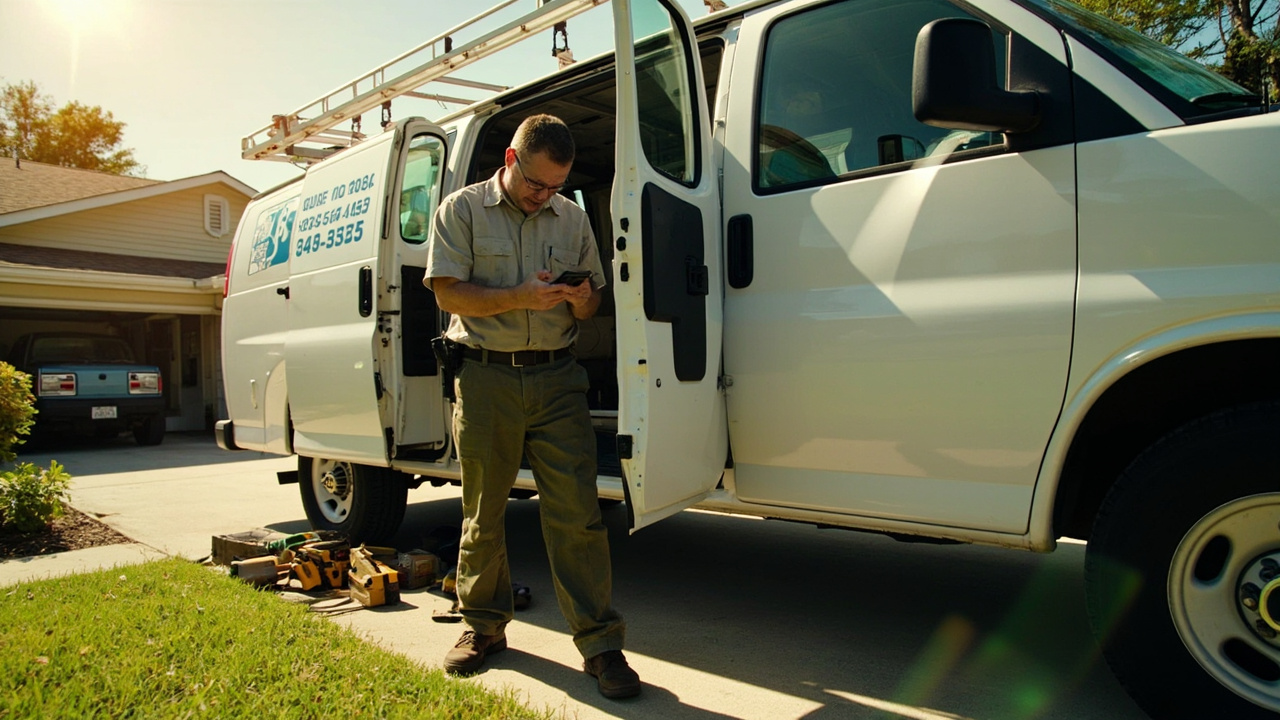
It is 7:45 on a Tuesday in July. Your service van is parked outside your shop, loaded with tools, fully fueled, and climatized. The technician inside is on the clock. But the first job of the day is not until 9:30, and the route between here and there will take 40 minutes through morning traffic. The dispatch board shows two other jobs in the queue, but they are 90 minutes away and not scheduled until 11:00. Your dispatcher is manually trying to figure out if it makes sense to send the truck early or wait.
This is not a slow day. This is a typical Tuesday in July for most HVAC contractors running 3 to 15 service vehicles. And the hidden cost of every hour your fleet sits still while your business is supposed to be running hot is between $85 and $140 per truck per hour. Most owners never see that number. They just notice the margin is thinner than last year and assume it is the labor market, the fuel prices, or the competition.
The math is more specific than that, and it is fixable.
What an Idle Truck Actually Costs Per Hour
The number is not arbitrary. It is a composite of four cost layers that add up every hour a van is not productively deployed.
Labor cost. Your technician is on the clock regardless of whether they are driving to a job or sitting in a parked van waiting for dispatch to figure out the schedule. Fully loaded labor cost (wage, payroll tax, vehicle, tools) for an experienced HVAC technician typically runs $45 to $65 per hour. When that technician is idle, you are paying for time that generates zero revenue.
Fuel. HVAC service vans run at near-maximum payload capacity with heavy equipment, refrigerants, and diagnostic tools. Alliance Fleet Solutions notes that fuel can account for 25 percent to 35 percent of total fleet operating expenses in this industry. Idling burns fuel with zero productive output.
Dispatch overhead. Every minute your dispatcher spends manually building routes, calling technicians to confirm timing, and adjusting schedules because of last-minute changes is overhead that does not scale. As your fleet grows, the dispatch complexity grows faster than the number of jobs.
Opportunity cost. Here is the part most contractors ignore. When a truck is stuck waiting for a schedule to open up or driving to a suboptimal location, you are losing the ability to take an emergency service call that would have paid $150 to $300 for that same hour. The opportunity cost of an idle van during peak season is the highest-margin work you could have run.
During summer and winter peak periods, the opportunity cost layer is at its highest. Emergency service rates are elevated, customer忍耐 is lowest, and your inbound call volume is highest. A van that is idle for three hours on a hot July Tuesday could have run two emergency callbacks at $200-plus each. That is the real cost you are not measuring.
The Real Cost Breakdown: Direct and Indirect
Most owners can see the direct costs of fleet downtime because they show up on a P&L statement: the repair invoice, the tow bill, the rental van cost while a primary vehicle is in the shop. But the indirect costs are where the real margin erosion happens, and they rarely appear anywhere as a line item.
Direct Costs (the ones you see)
- Technician wages during downtime periods
- Fuel consumed while idling or driving inefficient routes
- Vehicle repair and maintenance from reactive, rather than predictive, service
- Emergency labor rates when breakdowns happen during peak hours
Indirect Costs (the ones you absorb)
- Missed appointments caused by routing inefficiency
- Customer churn from late arrivals or inability to offer same-day service
- Dispatcher time spent on manual schedule adjustments
- Technician turnover driven by chaotic workdays and inconsistent schedules
- Revenue lost to competitors who had capacity available when you did not
The indirect costs are typically two to three times the direct costs in a poorly managed fleet. And unlike direct costs, you cannot audit them from your accounting software. You have to be looking for them specifically.
- Direct costs include technician wages during idle time, fuel burn while parked, reactive repair bills, and emergency labor rates.
- Indirect costs include missed appointments, customer churn, dispatcher overhead, technician turnover, and lost emergency service revenue.
- Indirect costs typically run two to three times the direct costs and are largely invisible in standard financial reporting.
Why Downtime Happens: The Three Root Causes
If you have been in HVAC fleet management for more than a year, you already know that some downtime is inevitable. Vehicles need service. Schedules change. But the contractors who consistently run high utilization rates have addressed three structural causes that most shops treat as normal operating expenses.
Cause 1: Poor Route Optimization
When dispatch is built around a mental model of where jobs are, rather than data about where jobs are and what the real drive time is, you get routing that looks logical on paper and produces 45-minute dead zones between stops. A technician might be theoretically available for a 10:00 job that is 25 minutes away, but if the previous job runs long and the route was not planned with buffer, that technician is now either late or unavailable.
Route inefficiency compounds. If each technician loses 20 to 30 minutes per day to suboptimal routing, that is 100 to 150 minutes of non-billable time per week across a five-truck operation. Over a 26-week peak season, that is 130 to 195 billable hours you never had a chance to capture.
Cause 2: Reactive Scheduling From Last-Minute Changes
When a customer cancels at 8:45 and the technician is already en route, or a job takes twice as long as estimated and the rest of the day collapses, reactive scheduling kicks in. Your dispatcher spends 20 to 30 minutes on the phone finding the next best assignment for that technician. In the meantime, the truck is either driving somewhere inefficient or sitting still.
Reactive scheduling is expensive in two directions. It costs the dispatcher time to find the next job, and it costs the technician time to get there. With a proactive system, cancellations and overruns generate automatic re-routing suggestions instead of panic calls.
Cause 3: No Real-Time Visibility Into Fleet Status
If you do not know where your trucks are, what your technicians are doing, or whether they are on schedule at any given moment, you are managing blind. When your dispatcher makes routing decisions without current location and status data, the decisions are based on assumptions that may be 30 to 60 minutes out of date.
Real-time fleet visibility is the foundation that makes route optimization and proactive scheduling possible. Without it, you are reacting to what already happened rather than managing what is happening right now.
Dispatch builds routes from memory and estimates. Schedule changes trigger manual phone calls. Vehicle location is approximate. Technician status updates are delayed 30 to 60 minutes. Downtime costs are absorbed as cost of doing business.
Routes are auto-generated from real-time location and job data. Schedule changes trigger automated re-routing suggestions. Vehicle location is live. Technician status updates are instant. Downtime is identified and minimized before it compounds.
The Fleet Utilization Audit: What Is Your Actual Rate
Industry data shows that the average HVAC service truck is productively deployed (driving to or working on a billable job) for only 40 percent to 55 percent of the workday. That means 45 percent to 60 percent of the day is non-billable, even for well-run operations. If you do not know where your shop falls on that spectrum, you are flying blind.
Here is how to calculate your actual utilization rate.
The Utilization Calculation
Over a two-week period, track the following for each truck: total hours on the clock, billable hours (actual work performed at a customer site), drive time between jobs, and idle time (waiting, lunch, breaks that extend beyond normal duration). Exclude lunch breaks and standard travel to and from the shop.
Your utilization rate is billable hours divided by total productive hours (billable plus drive time). If a technician is on the clock for 10 hours and has 4 hours of billable work and 2 hours of drive time, your utilization is 4 divided by 6, or 67 percent. The remaining 4 hours is non-billable overhead.
For most HVAC shops, the number comes in between 35 percent and 55 percent. The goal should be 65 percent to 75 percent during peak season. If you are below 50 percent, you have significant room to improve through routing software, telematics, and dispatch automation.
A contractor in central Pennsylvania runs 6 service vans. After tracking utilization for two weeks in August, he found his fleet was averaging 44 percent utilization. At $55 per hour fully loaded technician cost, that translated to $3,300 per week in non-billable labor across the fleet, or roughly $85,000 over a 26-week peak season. After implementing routing automation and telematics, utilization climbed to 61 percent within 60 days, recovering approximately $44,000 in seasonal revenue that had previously been invisible.
Technology Stack That Changes the Math
There is a difference between technology that collects data and technology that changes outcomes. GPS tracking tells you where your trucks are. Telematics tells you how they are being driven. Automated dispatch tells you what to do next. The value is in the third category, not the first two.
AI Telematics
Modern telematics goes beyond location tracking. AI-powered systems monitor engine health, cooling system performance, battery status, and driver behavior to predict failures before they result in a breakdown. Alliance Fleet Solutions notes that the shift from reactive repairs to predictive maintenance is the most significant evolution in HVAC fleet management. Since unplanned breakdowns cost significantly more than scheduled service due to emergency labor rates, lost revenue, and secondary component damage, predictive maintenance directly reduces the cost per idle hour.
Routing Software with Dynamic Optimization
Static routing software builds a route and holds it. Dynamic optimization software rebuilds the route continuously based on real-time data: traffic, job duration variance, new emergency calls, technician location. For a fleet running 15 to 25 jobs per day across six trucks, the difference between static and dynamic routing can be 90 to 120 minutes of recovered technician time per day.
Automated Dispatch and Job Assignment
Automated dispatch replaces the manual triage process with algorithmic job assignment. When a job opens up, the system evaluates all available technicians by location, skill match, current workload, and customer priority, then presents the optimal assignment. The dispatcher reviews and approves rather than building the schedule from scratch every time a change happens.
Rightsizing and Asset Management
Some downtime is structural. If you have more trucks than your job volume justifies, you are paying idle asset cost across your entire fleet. Rightsizing your fleet to match your actual workload, especially during shoulder seasons, reduces fixed cost per truck and improves utilization metrics by reducing the denominator.
The transition from reactive repairs to predictive maintenance marks the most significant evolution in HVAC fleet management for 2026. Waiting for a check engine light to appear is a strategy of the past.Alliance Fleet Solutions, HVAC Service Van Fleet Management: The 2026 Strategic Guide to Uptime
The Kortex360 Perspective: How Automation Ties Fleet Visibility to the Rest of the Business
Most fleet management conversations stop at the vehicle level. Telematics gives you data about the truck. Routing software gives you a better schedule. Those are real improvements. But the compounding value comes when fleet visibility is connected to the rest of your business operations.
Job Scheduling and Customer Communication
When your fleet data is integrated with your job scheduling system, customer communication changes. Instead of a customer waiting in the dark wondering when their technician will arrive, automated ETA updates go out based on the technician's actual real-time location. When a job runs long and the schedule shifts, the next customer gets an automatic update before they call to check. This reduces inbound call volume, improves customer satisfaction scores, and eliminates the dispatcher time spent on status calls.
Technician Retention and Steady Workload
Employee retention data from the HVAC industry shows that inconsistent work hours are a primary driver of technician turnover, especially during shoulder seasons. When fleet utilization is visible and managed, you can identify slow periods before they happen and shift workloads proactively, keeping technicians productively employed year-round. This is not just a retention play. It protects the significant investment you have already made in training and certifying your technicians.
Margin Visibility at the Job Level
When fleet data connects to your quoting and job management system, you can finally see margin at the job level, not just at the top line. You know which technicians generate the most billable hours per route, which job types produce the highest utilization, and which customers consistently require more time than estimated. That data informs pricing, staffing, and customer assignment decisions that compound over time.
What most contractors miss is that fleet management is not a standalone problem. It connects directly to customer communication, technician retention, and job-level margin visibility. Kortex360 automation links fleet visibility to the rest of your business so that a schedule change in one area automatically propagates to every other area that depends on it.
What to Do Right Now
If you are running more than three service vans and you have not done a utilization audit in the past six months, do one now. It takes two weeks and it will give you the baseline number you need to measure whether any changes you make are actually working.
Track total hours, billable hours, and drive time for every truck. Calculate utilization rates. Identify the trucks and technicians with the lowest and highest utilization and find out why. Look for patterns in the non-billable time: is it idle waiting, inefficient routing, or something else?
If you have fleet utilization below 50 percent and you are absorbing the cost as overhead, the question is not whether you are losing money. The math already answered that. The question is whether you want to do something about it.
If the answer is yes, talk to the Kortex360 team. We help HVAC contractors connect fleet visibility to job scheduling, customer communication, and technician utilization so that your fleet stops being a cost center and starts being a competitive advantage.